
Composite image creator frame#
The Composite image creator frame is a graphical interface to configure the
CompositeCreatorApp and to
visualize the results.
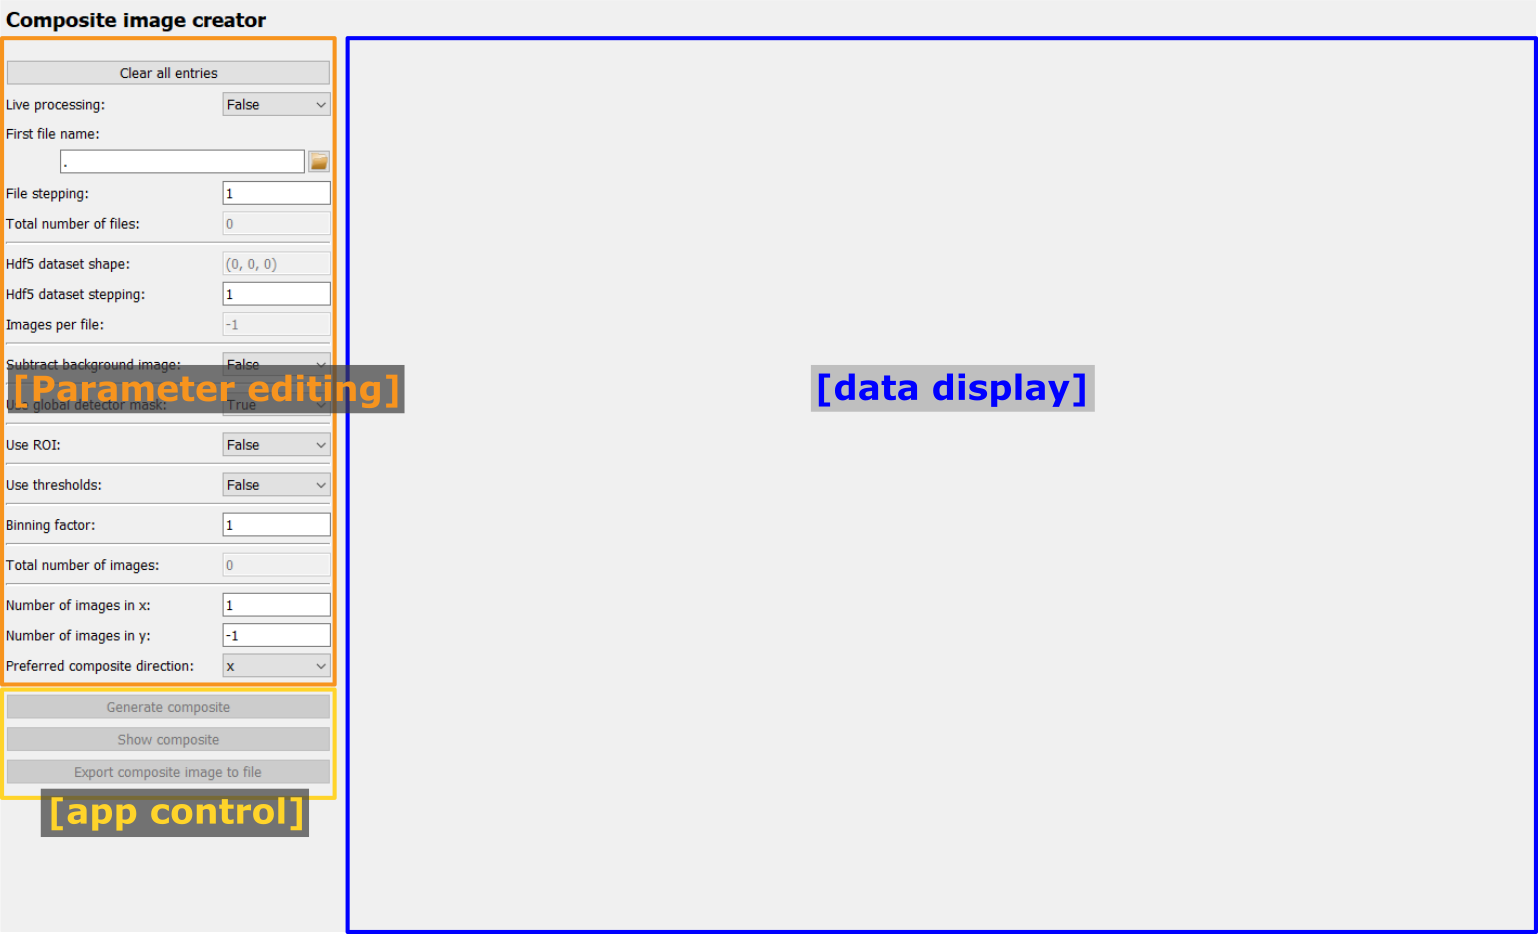
After starting the frame, only the menu for editing the Parameters is enabled (orange frame in the image below). For the tutorial about editing Parameters, please visit Editing Parameters in the GUI. The full list of Parameters and their description is given at the end in Full list of Composite image creator Parameters.
After setting the required Parameters, the app control panel (yellow frame in the image below) will become enabled and the user can start processing.
The processed composite image will be shown on the right side of the frame (blue area in the image below).
Control buttons#
Clear all entries#

The Clear all entries button at the top will reset all inputs to
their default values. Note that no confirmation will be asked of the user.
Generate composite#

Once the bare minimum Parameters have been selected (this is the first file name
and in case of an Hdf5 file the dataset), the Generate composite
button will be enabled. Clicking the button starts an
AppRunner process which loads
and processes the images in parallel processes.
Once clicked, the Generate composite button will be disabled and a
progress bar as well as an Abort button will appear:
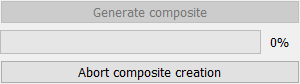
The progress bar will update with each received image and it shows the global
processing progress. The Abort button will stop the AppRunner. Any
data received by the Frame up to this point will be kept but the rest of the
composite image will only consist of zeros. The progress bar and the
Abort button will be hidden again after the Composite creation has
finished.
Note
After starting the AppRunner, it is normal that the first results need a few seconds to arrive because the new processes need to be started and load all required python packages.
Show composite#

During processing, the composite image is automatically updated. If the user
requires an additional manual update, the Show composite button can
be used to perform this update.
Save composite image#

The Save composite image button opens a dialogue to select a file
name. The image type is determined automatically based on the selected file
extension. A filter for all supported data types can be selected at the bottom
of the dialogue.
Result visualization#
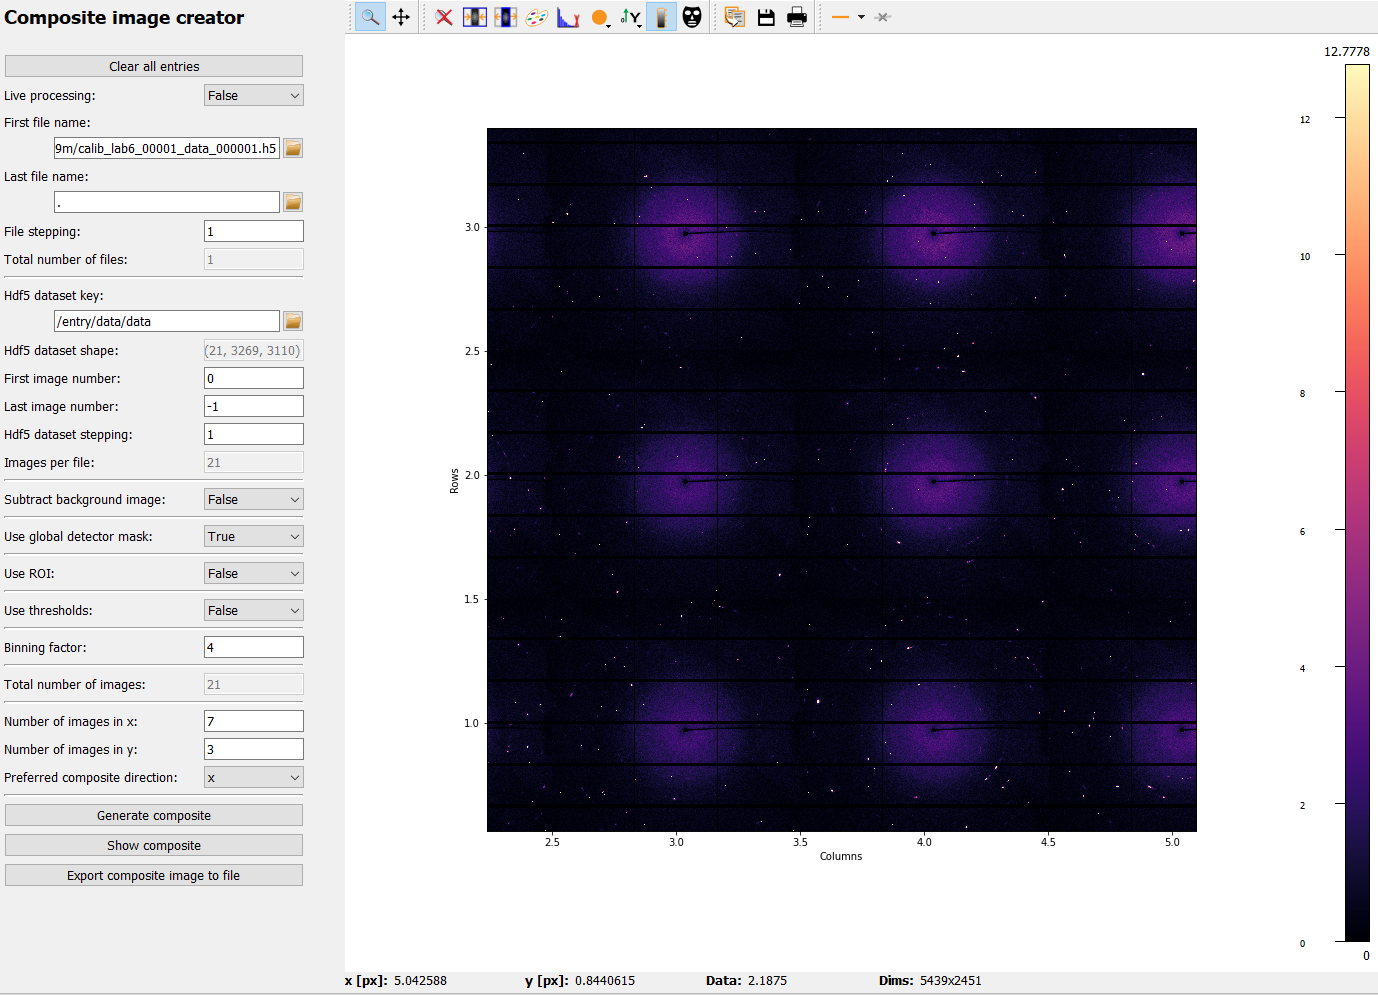
Results are visualized in a
PydidasPlot2d, described
below:
Pydidas 2D plot#
The PydidasPlot2d is a
subclassed silx Plot2d
with additional features useful in pydidas.
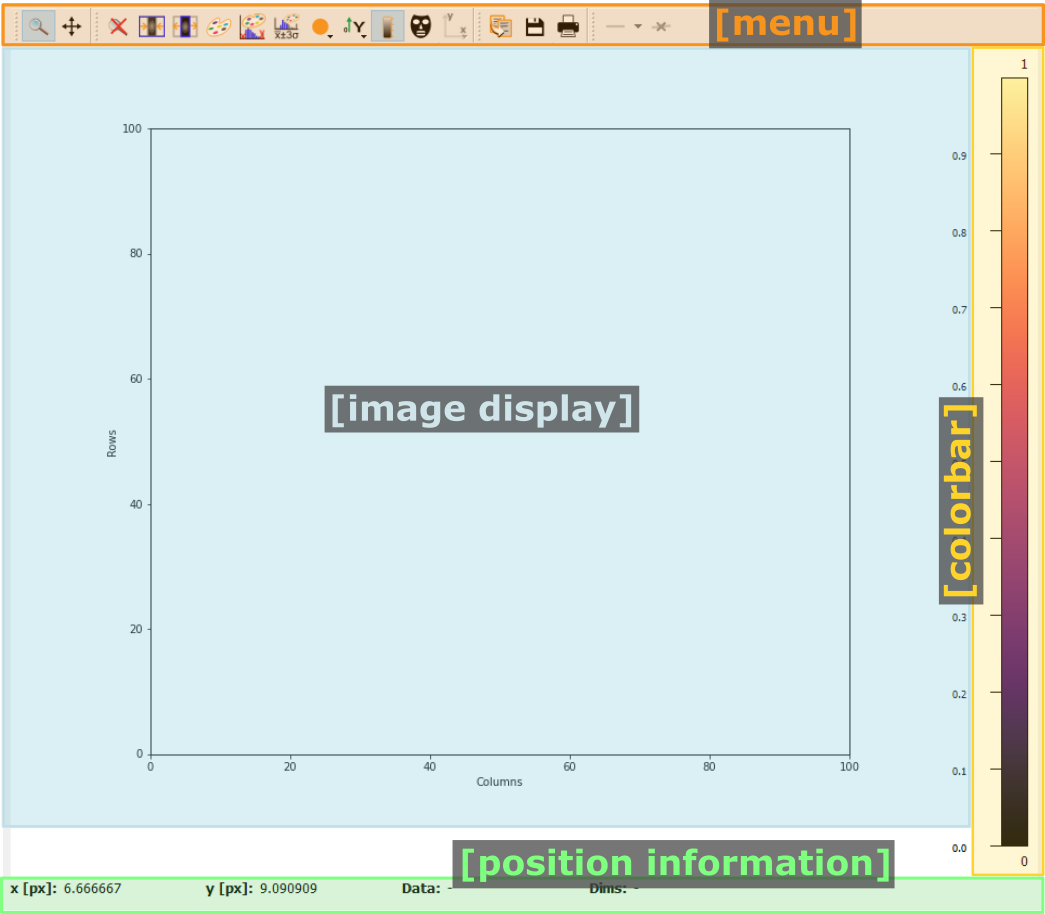
- The menu
The menu bar allows access to all generic silx and additional pydidas functionality. The detailed menu icons and actions are described below in the menu entries description.
- The image display
This widget shows the image data. Depending on the zoom level, this is either the full image or a sub-region.
- The colorbar
The colorbar shows the reference for the used colormap to map data levels to colors.
- The position information
This widget displays the coordinates and data values of the data under the mouse cursor.
Two-dimensional plots are presented in a silx Plot2D widget. The toolbar options will be explained in detail below. Moving the mouse over the canvas will update the labels for x/y position and data value at the bottom of the canvas. Note that the x and y axis positions for each pixel are defined at the pixel center and the given values must be treated carefully with respect to the pixel shape, especially for coarse pixels.
Tip
Scaling of the results can be achieved by modifying the colormap settings.
Menu entries description#
Menu icon |
Description |
|||
|---|---|---|---|---|

|
Zoom mode: clicking with the mouse and dragging spans a new selection of the data to be visualized. |
|||

|
Panning mode: clicking with the mouse and dragging moves the data on the canvas. |
|||

|
Unzoom: Reset the display region to the full data. |
|||
|
Lock the zoom at the current settings. The button will show the current lock state in its icon and description and a click will toggle between the locked and unlocked state. When the zoom is locked, the display region will not change when loading new data. |
|||
|
Toggle the canvas size. Clicking this button will toggle between the two options and change the icon accordingly. Options are a. Match canvas and b. Expand canvas. Match canvas to the data: Set the aspect ratio to 1 and match the canvas size to the data to allow a tight fit. Or Expand the canvas: Reset the canvas size to take up all available space. This option does also change the data aspect ratio to make use of the full canvas. |
|||

|
Open the colormap editor: This button opens a window with selections for the colormap and scaling of the displayed minimum and maximum values. |
|||

|
Crop histogram outliers: Calculate the histogram of the image and set the colormap to ignore the low x% and the top y% of the image histogram. The levels of x and y can be adjusted in the pydidas user settings. |
|||

|
Autoscale the colormap to the image minimum and maximum values. |
|||

|
Autoscale the colormap to the image mean value +/- 3 standard deviations. |
|||

|
This action allows to control the aspect of the displayed data and allows to stretch the data to fill the available canvas or keep its original aspect ratio. |
|||

|
Control the position of the origin in the image: Select between the top left and bottom left corner. |
|||

|
Display or hide the colorbar on the drawing canvas. |
|||

|
Mask tools: This button opens an additional widget at the bottom of the canvas with tools for importing or setting a mask to mask certain data regions. |
|||

|
Set coordinate system: This button will open a submenu which allows to
select the coordinate system (cartesian or cylindrical). Note that the
cylindrical coordinate system uses the global
|
|||

|
Get information for selected datapoint: This button allows the user to click on a point in the image and show a window with additional information about this point (specifically: all indices / data values). |
|||

|
Copy the currently visible figure to the clipboard. This will only copy the main figure and not the colorbar. |
|||

|
Save the currently loaded full data to file, ignoring any zooming. This function will open a dialogue to select the file type and filename. Depending on the selected file type, the colormap and scaling will be retained (e.g. for png export) or ignored (e.g. tiff export). |
|||

|
Print the currently visible figure. This will print only the data visible on the canvas and it will retain colormap and scaling settings. |
|||

|
Create and delete line profiles. This function allows the selection and editing of line profiles. The line profiles are shown in the histogram plots for the vertical and horizontal axes, respectively. |


Full list of Composite image creator Parameters#
- live_processing (bool, default: False)
Keyword to toggle live processing which means file existance and size checks will be disabled in the setup process and the file processing will wait for files to be created (indefinitely).
- first_file (Union[str, pathlib.Path], default: Path() [empty path])
The name of the first file for a file series or of the hdf5 file in case of hdf5 file input.
- last_file (Union[str, pathlib.Path], default: Path() [empty path])
Used only for file series: The name of the last file to be added to the composite image.
- file_stepping (int, default: 1)
The step width (in files). A value n > 1 will only process every n-th image for the composite.
- hdf5_key (type: Hdf5key, default: entry/data/data)
Used only for hdf5 files: The dataset key.
- hdf5_first_image_num (type: int, default: 0)
The first image in the hdf5-dataset to be used.
- hdf5_last_image_num (type: int, default: -1)
The last image in the hdf5-dataset to be used. The value -1 will default to the last image in the file.
- hdf5_stepping (type: int, default: 1)
The step width (in images) of hdf5 datasets. A value n > 1 will only add every n-th image to the composite.
- use_bg_file (type: bool, default: False)
Keyword to toggle usage of background subtraction.
- bg_file (type: Union[str, pathlib.Path], default: Path() [empty path])
The name of the file used for background correction.
- bg_hdf5_key (type: Hdf5key, default: entry/data/data)
Required for hdf5 background image files: The dataset key with the image for the background file.
- bg_hdf5_frame (type: int, default: 0)
Required for hdf5 background image files: The image number of the background image in the dataset.
- use_global_det_mask (type: bool, default: True
Keyword to enable or disable using the global detector mask as defined by the global mask file and mask value.
- use_roi (type: bool, default: False)
Keyword to toggle use of the ROI for cropping the original images before combining them.
- roi_xlow (type: int, default: 0)
The lower boundary (in pixel) for cropping images in x, if use_roi is enabled. Negative values will be modulated with the image width.
- roi_xhigh (type: Union[int, None], default: None)
The upper boundary (in pixel) for cropping images in x, if use_roi is enabled. Negative values will be modulated with the image width, i.e. -1 is equivalent to the full image size minus one. None corresponds to the full image width (with respect to the upper boundary).
- roi_ylow (type: int, default: 0)
The lower boundary (in pixel) for cropping images in y, if use_roi is enabled. Negative values will be modulated with the image height.
- roi_yhigh (type: Union[int, None], default: None)
The upper boundary (in pixel) for cropping images in y, if use_roi is enabled. Negative values will be modulated with the image height, i.e. -1 is equivalent to the full image size minus one. None corresponds to the full image height (with respect to the upper boundary).
- use_thresholds (type: bool, default: False)
Keyword to enable or disable the use of thresholds. If True, threshold use is enabled and both threshold values will be used.
- threshold_low (type: int, default: None)
The lower threshold of the composite image. If any finite value (i.e. not np.nan or None) is used, the value of any pixels with a value below the threshold will be replaced by the threshold value. A value of np.nan or None will ignore the threshold.
- threshold_high (type: int, default: None)
The upper threshold of the composite image. If any finite value (i.e. not np.nan or None) is used, the value of any pixels with a value above the threshold will be replaced by the threshold value. A value of np.nan or None will ignore the threshold.
- binning (type: int, default: 1)
The re-binning factor for the images in the composite. The binning will be applied to the cropped images.
- composite_nx (type: int, default: 1)
The number of original images combined in the composite image in x direction. A value of -1 will determine the number of images in x direction automatically based on the number of images in y direction.
- composite_ny (type: int, default: -1)
The number of original images combined in the composite image in y direction. A value of -1 will determine the number of images in y direction automatically based on the number of images in x direction.
- composite_image_op (type: str, default: None)
The image operation applied to each raw image prior to merging it in the composite image. This allows to adjust the image orientation with respect to the scan.
- composite_xdir_orientation (type: str, default: left-to-right)
The direction of how images are inserted into the composite in x direction. Left-to-right starts with low indices (python standard) whereas right-to-left will insert image at the max index position first.
- composite_ydir_orientation (type: str, default: top-to-bottom)
The direction of how images are inserted into the composite in y direction. Top-to-bottom starts with low indices (python standard) whereas bottom-to-top will insert image at the max index position first. Note that the display may be flipped with the origin at the bottom.