
Select integration region window#
The Select integration region window allows to visualize the integration ROI in the image as well as changing the boundaries by clicking directly in the image.
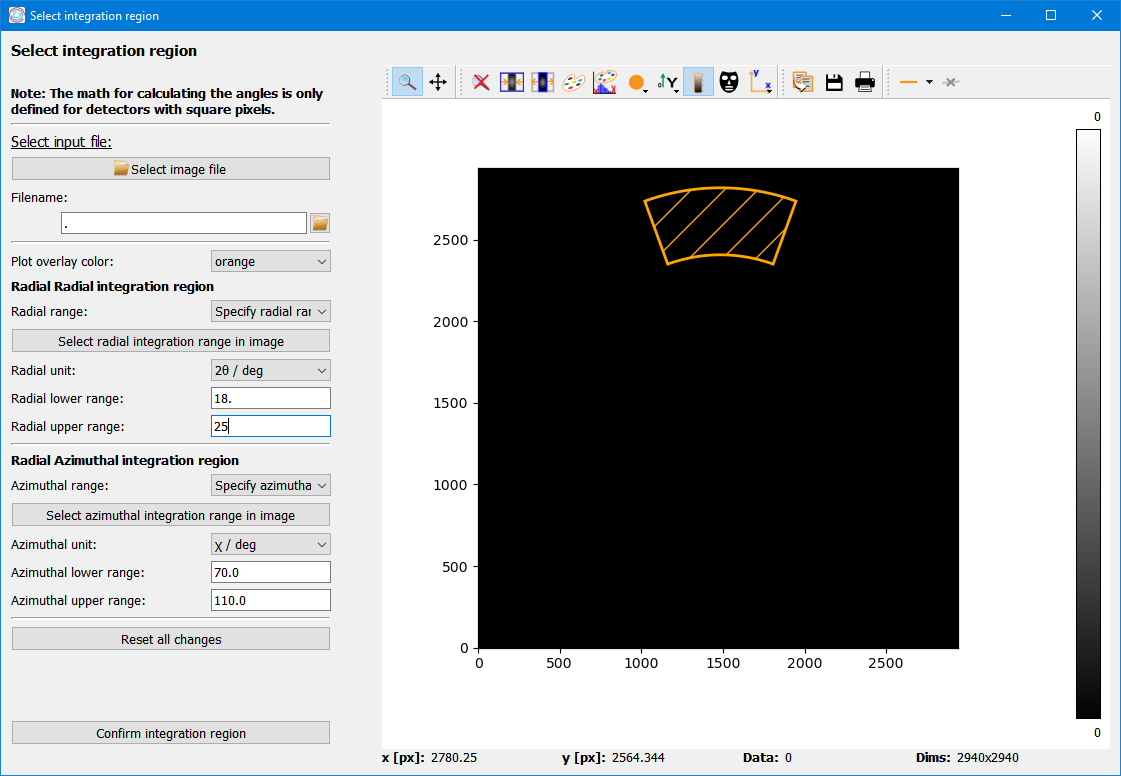
The left side offers controls for loading images, adjusting the integration regions and starting the graphic selection. The image with the integration region overlay is shown on the right. Note that if no image has been selected yet, an image with zero intensity in the correct detector dimensions is shown.
Controls#
File input#
The input file can be selected in any one of four ways:
Use the “Select image file” button at the top.
Enter the full file path in the input field.
Use the small “open” button right of the input field.
Drag and drop a file from the system’s file explorer.
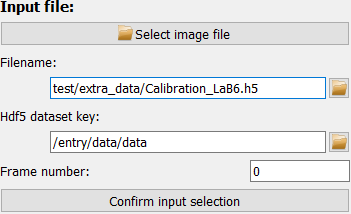
If the filename is valid, the selected file will be displayed immediately.
For hdf5 files, however, you need to select data the dataset and frame number first and confirm the selection with the “Confirm input selection” button before any frame is loaded and displayed.
After loading an image, the current integration region is shown as an overlay. By default,the overlay is orange and will cover the full image (because the full detector is used by default).
Plot overlay#
The Parameter for the plot overlay color allows to select a number of different colors to increase the overlay visibility for a wide range of colormaps.
Manual selection of integration regions#
Any of the parameters for the integration range and limits can be updated in the Parameter edit widgets. Any changes made will be displayed in the plot for inspection.
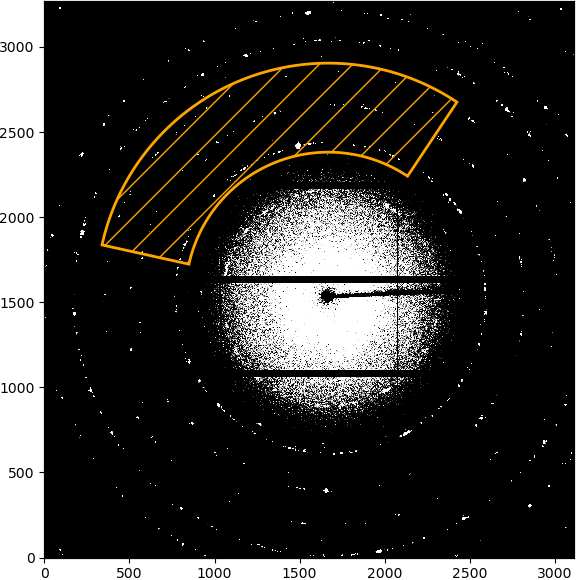
Selecting radial integration range in image#
If the azimuthal range is “Full detector”, nothing will be displayed to start with. If a range has been selected, the limits of the range will be marked by two lines starting from the beamcenter. Clicking on the first point will set the inner radial limit, which will be displayed as a circle. Clicking a second time will set the upper limit and the selected integration ROI will be displayed as overlay.
|
|
|
|---|---|---|
The starting azimuthal limits without any radial selection. |
After selecting the inner radial limit, it is shown as a circle. |
After selecting the outer radial limit as well, the final integration ROI is displayed. |
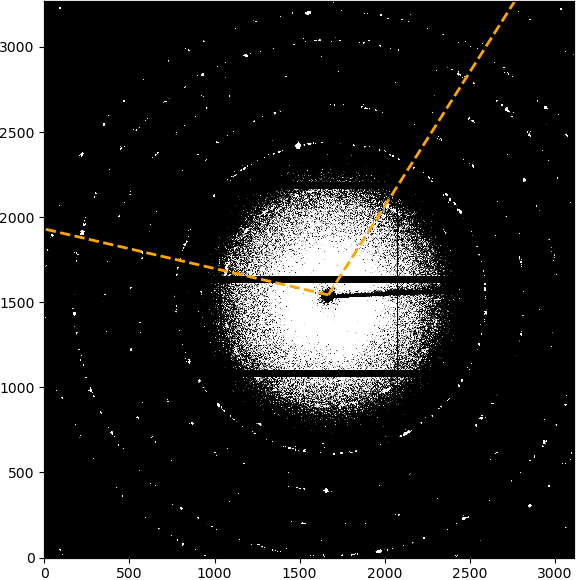
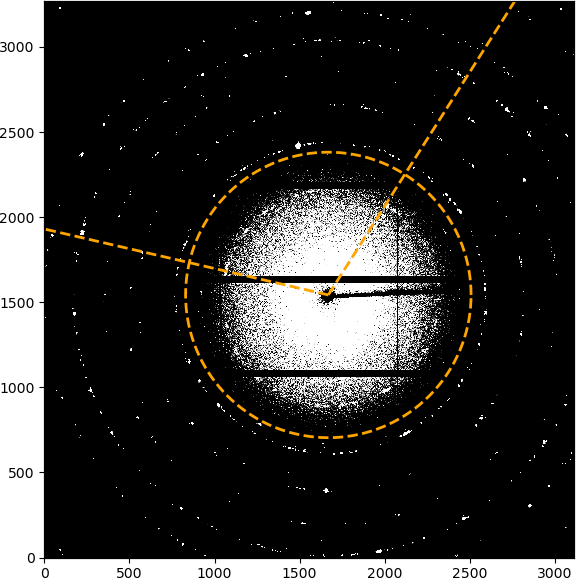
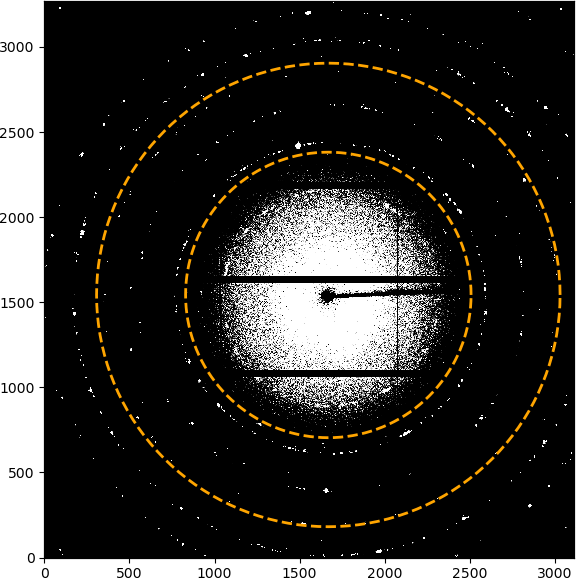
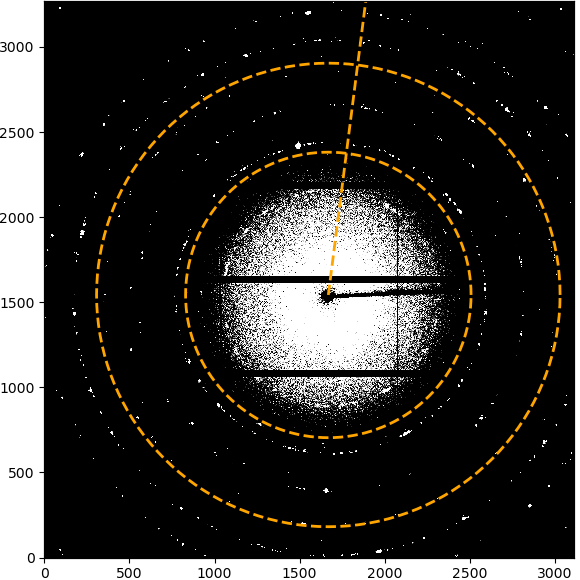
Selecting azimuthal integration range in image#
If the radial range is “Full detector”, nothing will be displayed to start with. If a range has been selected, the limits of the range will be marked by two circles around the beamcenter. Clicking on the first point will set the starting radial limit and draw a line from the beamcenter. Clicking a second time will set the upper limit and the selected integration ROI will be displayed as overlay.
|
|
|
|---|---|---|
The starting radial limits without any azimuthal selection. |
After selecting the lower azimuthal limit, it is shown as a line from the beamcenter. |
After selecting the upper azimuthal limit as well, the final integration ROI is displayed. |